

UPDATE: This article was published on September 2. On September 3, Metro announced a change to their 7-day Positive Test Rate calculation which more closely aligns with the way the state is calculating it, as well as our understanding and calculations in the article. We are appreciative of this change and applaud all efforts to increase transparency in the calculations used in reopening guidance.
Recently, we wrote about some discrepancies between various sources for the number of available hospital beds in Davidson County. Metro Nashville appears to be using one number of available beds; the state appears to be using another (and this coincides with other sources, and statements made by Metro Coronavirus Task Force leader Alex Jahangir earlier in the year).
These sorts of problems, however, are not limited to the hospital bed capacity. Today, we tackle another example of a metric tracked by Metro Nashville which is at odds with other data sources: The 7-Day Positive Test Rate. As of this writing (September 2), the official figure reported by Metro is 9.0%, just below the stated goal of 10.0% or below.
As with hospital bed capacity, this calculation is pretty simple, and doesn't require a ton of math beyond a simple division: All we need to know is the number of positive test results in the last 7 days, for the numerator, and the total number of test results (positive OR negative) in the last 7 days, for the denominator.
If it were only that simple!
One may think that Metro's daily press updates might contain the data we need to recreate their figure. After all, these updates contain a table each day that looks like this:
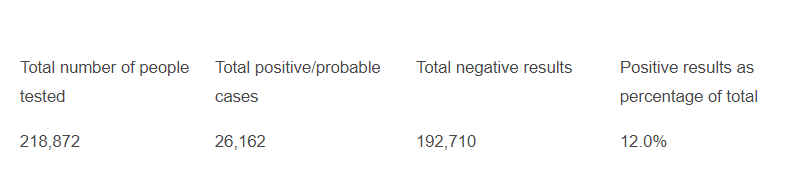
Of course, these are cumulative figures - we care about the 7-day rate. Fortunately, Metro archives all of these updates, so we can go back 7 days to August 26 to see what the numbers looked like then. The difference between the two reports is the new activity over a 7-day period; seems intuitive that this would match the Metro-reported figure.
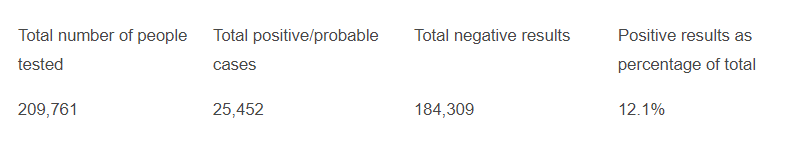
Taking the difference between the two reports, we can see that Metro has reported 710 new "positive/probable cases" in the last 7 days, and has reported 8,401 "negative results." If we divide the positives (710) by the total results (710 + 8,401), we get... 7.79%. That's quite a bit lower than the 9.0% on the homepage!
In fact, the official Metro number has been higher than our calculated number fairly consistently since the 7-Day Positive Test Rate was introduced as a reopening metric on August 6, and has almost always been higher since July 9. Given that this has been introduced as a metric that Metro is tracking to assess reopening, it seems important for metro to get this right, or at least make clear what they're doing.
So, whatever Metro is doing, it's clearly not the intuitive calculation we've just described. Fortunately, there are other data elements and sources that we can use to test alternative hypotheses. The most straightforward comes from the Tennessee Department of Health: Each day, they publish an update of data by county in a couple different downloadable files.
- The first, "Public Dataset Daily Data Snapshot", contains current data for each county, which includes the 7-day Positive Test Rate in a column labeled "PERC_POST_LAST7". It also contains the new total tests and new positive tests for the current day, and the sum of total tests and positive tests for the last 7 days. The last two figures can be used to directly calculate their 7-day Positive Test Rate.
We have a problem here, though: the state's number for Davidson County is just 4.68%. This doesn't tie to either of the numbers we presented before, and notably, is almost half of the rate reported by Metro to assess reopening guidelines.
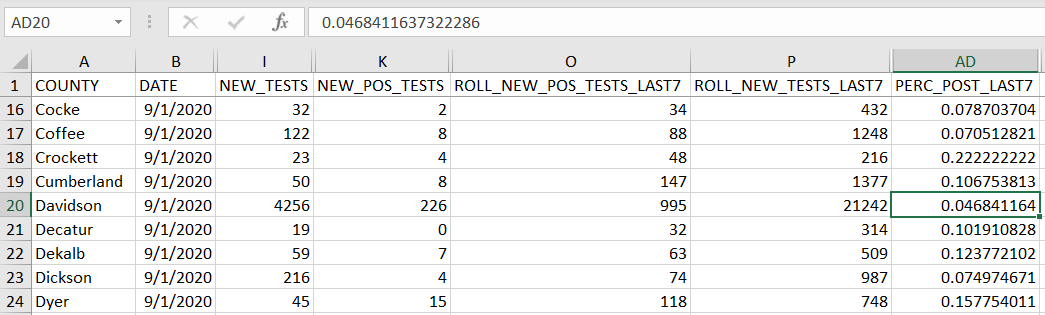
- A second dataset from the state on the same web page, "County New", has much of this data historically day-by-day. From this, we can not only verify that our understanding of the state's 7-Day Positive Test Rate calculation is correct, we can also check their 7-day test totals.
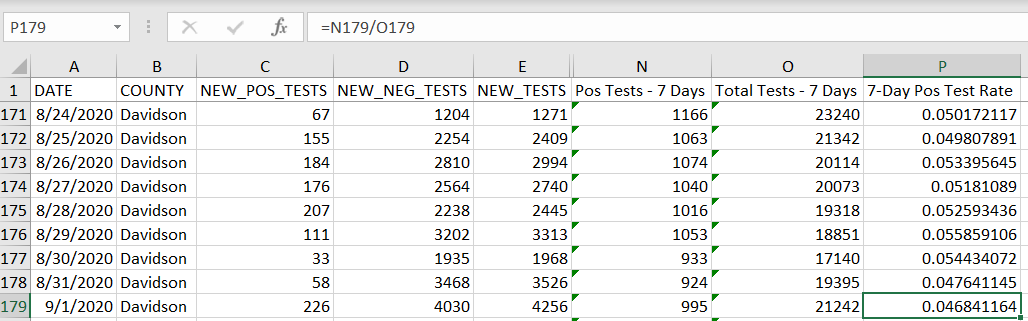
The three rightmost columns (N, O, and P) have been added by us to demonstrate that this data ties to the first dataset that we examined for 9/1. Specifically, column N sums the positive tests in the last 7 days and gets 995; column O sums the total tests in the last 7 days and gets 21,242; column P divides these two figures. All of the data matches from the first file. This means we can look at how the state's 7-Day Positive Test Rate has evolved over time, and how it has differed from Metro's number.
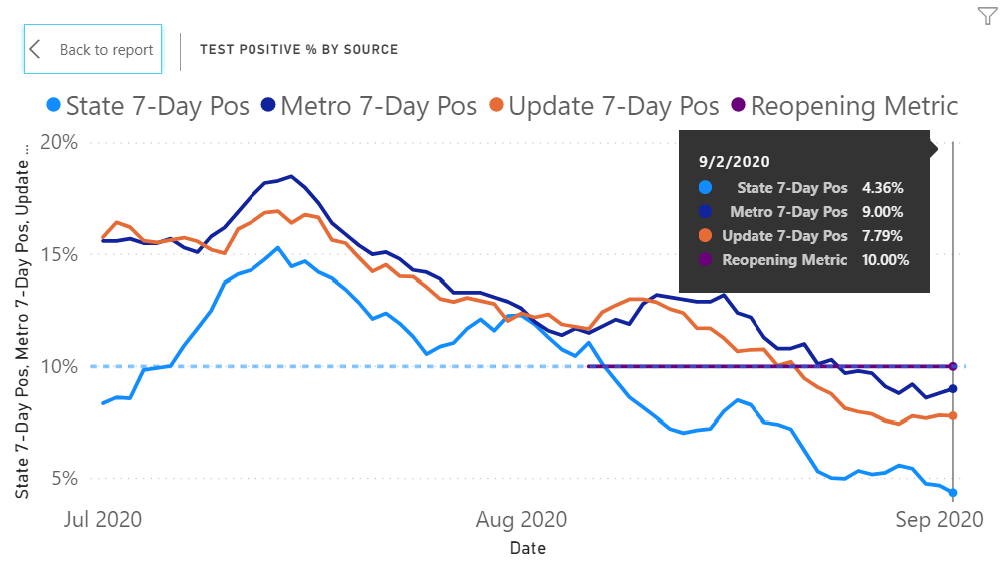
Rather than getting us closer to an understanding of Metro's 9.0% rate, however, this exercise has taken us farther away. The state's figure of 4.68% is even further away than the 7.79% figure we calculated from Metro's daily updates. We track all three of these figures over time, sourcing them in the ways described above, here.
What else can we do to try to match Metro's figure? Well, there is one other option, which Metro only made available to the public beginning on August 21. The Davidson County COVID-19 Dashboard provides a tab called "COVID-19 Epidemiology and Surveillance Updates", which takes the form of a PDF report with additional data not available elsewhere. It also lags the current day's data by one day, so as of this writing on September 2, the report is dated September 1. Still, since we're tracking this data over time, it may be useful.
Page 7 of this report contains a section that looks like this:
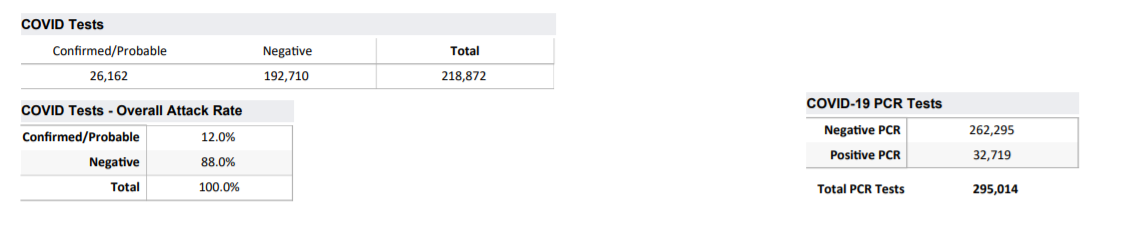
The numbers on the left under "COVID Tests," you'll notice, match with what Metro provides on their daily press updates. However, despite referring to these as "tests," it appears they would more accurately be described as "de-duplicated test results," given the additional information on the right-hand side: "COVID-19 PCR Tests." In this section, there are higher figures for all 3 values ("Negative PCR", "Positive PCR", and "Total PCR Tests").
This data is not archived historically on Metro's website; our team has been saving this file each day to keep a historical account of how these figures change. Above, we show the "PCR Test" data on September 1. 7 days prior, on August 25, this data looked like this:
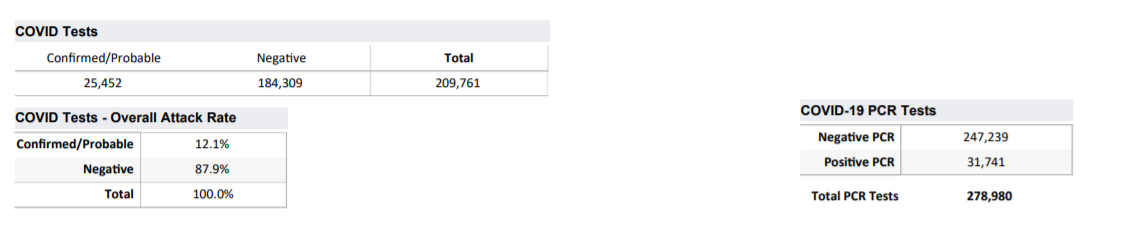
If we take the differences in the "PCR Tests" data, we get 978 positives out of X total tests, resulting in a 7-Day Positive Test Rate of 6.10% - lower than both Metro numbers we had before, and closer to (but still higher than) the state's number.
So, after all of this, we are still at a loss. Nothing we have done has resulted in a 9.0% positive test rate for Davidson County over the past 7 days. Our final check is to look at the daily test result counts themselves. While this is unlikely to get us to a satisfying conclusion, we may at least be able to discern patterns in the differences between test totals reported by the state and those reported by Metro.
As a precursor, though: We know that Metro receives data from the state, and not the other way around. We know this because on June 28, the state Department of Health released a statement that they would not be able to report due to technical difficulties. Metro, however, reported their daily update as usual on June 28; it was one day later, on June 29, that they were unable to report, stating: "The Metro Public Health Department receives COVID-19 test results from the Tennessee Department of Health for our Daily Update." So the appropriate comparison is between Metro's data today and the state's data yesterday.
Here are the new positive and negative figures derived from each of these sources for the 7 days preceding September 1 (which is the last day for which we have all of the aforementioned data sources available to review):
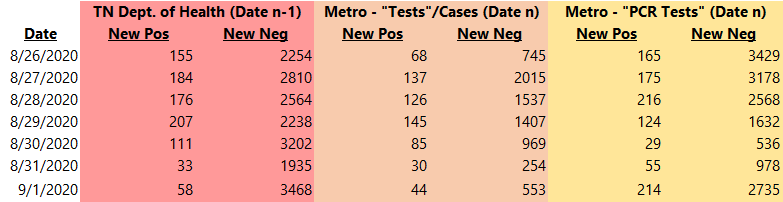
This table makes it more clear that what they call "Tests" (orange) in their daily press updates are actually de-duplicated cases. But the comparison between the state's data (red/left) and Metro's daily PCR tests a day later (yellow/right) only serves to add more confusion. When we started this journey comparing the daily press updates to the state data, we thought it was clear that there was a filtering process resulting in lower numbers. Now, however, we believe there must be both a filter on the state data and additions made to the data from Metro's own sources. In several recent days, new positive tests reported by Metro have exceeded those reported by the state for the same time period. On 8/31 and 9/1, new positives reported by Metro were higher than that reported by the state, but new negatives were lower. This suggests filtering and merging from a data source that is not publicly available.
Whatever that process, we're not able to reproduce Metro's reopening metric, neither through the data that they themselves provide, nor through the data that the state Department of Health provides. Moreover, those two data sources are increasingly at odds with one another throughout August and into September. A simple problem of division with at least three answers that we can come up with, none of which match how Metro is calculating the metric (which is higher than all of them).
We're not sure why.